Every futures trader has been there: you are staring at six indicators, three of them say "buy," two say "sell," and one is neutral. You are paralyzed. The setup looks good on the 5-minute chart but terrible on the 15. Volume confirms the move, but VWAP says you are overextended. What do you do?
This is the problem that composite scoring was built to solve. Instead of forcing you to mentally weigh a dozen conflicting signals, QubTrading's proprietary AI signal engine evaluates 10 independent factors simultaneously and distills them into a single, actionable number -- a composite score that tells you exactly how strong a potential trade setup is, right now, across every dimension that matters.
Table of Contents
What Is Composite Scoring?
A composite score is a single numerical value that represents the overall quality of a trade setup by combining multiple independent measurements into one unified assessment. Think of it like a credit score for trades: just as a credit score distills payment history, debt utilization, account age, and other factors into one number that banks use to make lending decisions, a composite trade score distills momentum, trend alignment, volume, and other market factors into one number that traders use to make entry decisions.
QubTrading's AI-optimized 10-factor scoring system uses multi-panel AI analysis to evaluate market conditions across multiple timeframes simultaneously. Each of the 10 factors contributes to the final score, and the proprietary AI signal engine determines how much weight each factor receives based on current market conditions.
Key Concept: A composite score is not an average of indicators. It is an AI-optimized synthesis that accounts for how factors interact with each other. Two setups with identical RSI readings can receive very different composite scores because the surrounding context -- trend, volume, session timing, volatility -- is different.
Why Single Indicators Fail
Before diving into the 10 factors, it is worth understanding why the traditional approach of relying on one or two indicators produces inconsistent results -- and why so many traders plateau despite years of experience.
The False Confidence Problem
A single indicator can look convincing in isolation. RSI crosses above 30 -- "oversold bounce incoming." MACD crosses bullish -- "momentum shift confirmed." But these signals are notoriously unreliable on their own. Studies consistently show that individual technical indicators produce win rates barely above random chance when used in isolation, typically in the 45-55% range.
Conflicting Signals
The natural response is to add more indicators. But more indicators without a systematic way to combine them creates a different problem: conflicting signals. When RSI says buy but MACD says sell and Bollinger Bands are neutral, the trader is left making a subjective judgment call -- exactly the kind of emotional, inconsistent decision-making that produces erratic results. As we covered in our AI vs. manual trading comparison, this is where human cognition hits its limits.
Missing Context
The deepest flaw with single-indicator trading is that no individual indicator captures market context. A bullish RSI reading during a strong downtrend is a very different signal than the same reading during an uptrend pullback. Without incorporating trend, volume, session timing, and volatility regime, you are trading pattern matches without understanding what the pattern means in the current environment.
Common Mistake: Adding more indicators to your chart does not create a composite scoring system. Without a systematic, weighted method of combining signals, more indicators simply create more noise and more opportunities for analysis paralysis.
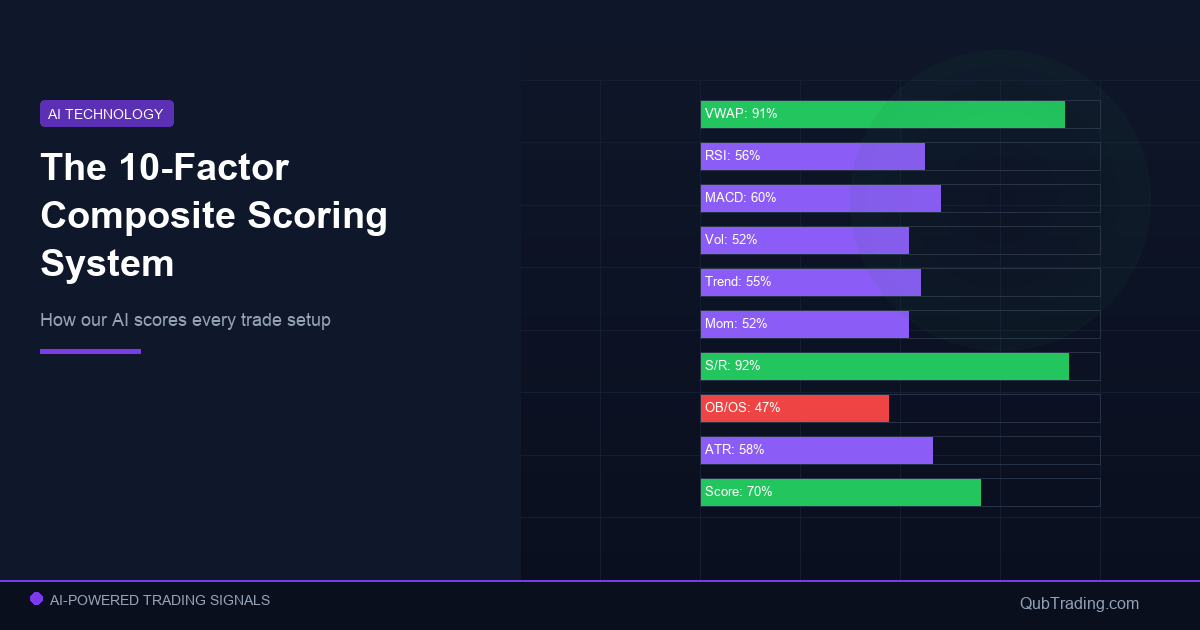
The 10 Factors Behind Every Score
QubTrading's proprietary AI signal engine evaluates 10 independent factors for every potential trade setup. Each factor captures a different dimension of market behavior, and together they provide a comprehensive view that no single indicator can match. Here is what the system analyzes:
1. Panel Alignment
Multi-panel AI analysis evaluates directional agreement across multiple independent timeframes. When short-term, medium-term, and long-term panels all point in the same direction, the probability of a successful trade increases significantly. Full alignment across all panels is rare -- and when it happens, the resulting signals tend to be the highest quality of the day.
2. Momentum
The system measures the rate and acceleration of price movement, not just its direction. Strong momentum means price is moving decisively. Weakening momentum -- even if the trend is still intact -- suggests the move may be exhausting. The AI engine differentiates between fresh momentum (early in a move) and stale momentum (late in a move), which is critical for timing entries.
3. Trend
Trend analysis goes beyond simple moving average crossovers. The system evaluates trend strength, trend age, and trend consistency across timeframes. A new trend with accelerating strength scores differently than a mature trend showing signs of exhaustion. Trading with the trend is one of the most reliable edges in futures markets, and this factor ensures the composite score reflects that reality.
4. Volume
Volume confirms conviction. A price breakout on thin volume is far less reliable than the same breakout on heavy volume. The AI engine evaluates current volume relative to session averages, identifies volume spikes that often precede major moves, and detects volume divergences where price makes new highs but volume is declining -- a classic warning sign.
5. VWAP Deviation
Volume-Weighted Average Price (VWAP) represents the "fair value" that institutional traders use as a benchmark. The composite score tracks how far price has deviated from VWAP and in which direction. Extreme deviations often signal mean-reversion opportunities, while price holding above or below VWAP for extended periods confirms directional bias. This factor is especially powerful during the regular trading session when institutional volume is highest.
6. Market Structure
Market structure analysis identifies key levels: swing highs and lows, support and resistance zones, and the pattern of higher highs/higher lows (or lower highs/lower lows) that defines market character. The AI engine evaluates whether the current setup aligns with or contradicts the prevailing market structure, adding a layer of context that pure indicator-based systems miss entirely.
7. Session Context
Not all hours are created equal. The same setup during the pre-market session has very different characteristics than during the US market open or the midday doldrums. Session context accounts for time-of-day patterns, session-specific volatility profiles, and the tendency for certain types of setups to perform better during specific market phases. A strong setup during the opening drive carries more weight than the same setup at 1 PM.
8. Volatility Regime
Markets cycle between low-volatility compression phases and high-volatility expansion phases. The scoring system identifies which regime is currently active and adjusts expectations accordingly. During low-volatility environments, breakout signals receive a boost because compression often precedes expansion. During high-volatility environments, mean-reversion signals gain weight. This adaptive behavior is essential for maintaining signal quality across changing market conditions.
9. Order Flow
Order flow analysis evaluates the balance between buying and selling pressure at the current price level. The AI engine assesses whether aggressive buyers or sellers are dominating, whether large institutional orders are entering the market, and whether the order book structure supports the directional bias suggested by other factors. This provides a real-time view of supply and demand that lagging indicators cannot capture.
10. Adaptive Performance
This is the factor that makes the system truly intelligent. The AI engine continuously tracks its own recent performance -- which types of signals are working, which are not, and how market conditions are affecting results. If momentum-based signals have been producing strong results recently, the system recognizes this pattern. If a certain session window has been underperforming, the system accounts for it. This self-correcting feedback loop means the composite score is always calibrated to current conditions, not just historical averages. Learn more about adaptive risk management in our comprehensive risk management guide.
Why 10 Factors? Extensive testing revealed that fewer than 8 factors leave blind spots in signal quality, while more than 12 factors introduce noise without improving accuracy. The 10-factor model represents the optimal balance between comprehensiveness and signal clarity -- confirmed by thousands of hours of live market validation.
How Scores Combine Into One Number
Having 10 independent factor assessments is powerful, but it only becomes actionable when those assessments are synthesized into a single number. This is where QubTrading's AI-optimized scoring system truly differentiates itself from traditional indicator stacking.
Dynamic Weighting
Not all factors matter equally in all market conditions. During a trending market, trend alignment and momentum carry more weight. During a ranging market, VWAP deviation and market structure become more important. The AI engine dynamically adjusts factor weights based on the current volatility regime, session context, and recent adaptive performance data. This means the composite score is not a static formula -- it is a living, adaptive assessment that evolves with the market.
Factor Interaction
The scoring system also accounts for how factors interact. Momentum and trend alignment reinforce each other -- strong momentum in the direction of the prevailing trend is more significant than strong momentum against it. Volume and order flow have a multiplicative relationship: high volume with one-sided order flow is far more meaningful than high volume with balanced flow. These interactions are captured in the composite score through the AI engine's pattern recognition.
Normalization
Raw factor measurements operate on different scales. Momentum might be measured in points per minute, VWAP deviation in standard deviations, and panel alignment as a percentage. The AI engine normalizes all factors to a common scale before combining them, ensuring that no single factor dominates the score simply because its raw values happen to be larger. The result is a clean, interpretable number that accurately reflects overall setup quality.
Score Thresholds and What They Mean
The composite score is most useful when interpreted through defined thresholds. While the exact thresholds are optimized by the AI engine and adjust dynamically, here is a general framework for understanding what different score levels mean:
High Scores: Premium Setups
A high composite score indicates that the majority of factors are aligned in the same direction with strong conviction. These are the "A+" setups that experienced traders wait for -- the ones where trend, momentum, volume, market structure, and session context all agree. High-score setups typically occur only a few times per session, but they offer the best risk-reward ratios and highest win rates. When the system fires a high score, it is worth paying close attention.
Medium Scores: Selective Opportunities
Medium scores represent setups where most factors are supportive but one or two are neutral or slightly conflicting. These trades can still be profitable, but they carry more uncertainty. Experienced traders often take medium-score setups when they align with their own read of the market, while newer traders may choose to wait for higher scores. This is the zone where the hybrid approach -- combining AI signals with human judgment -- is most valuable.
Low Scores: Sit on Your Hands
Low composite scores mean that the factors are either conflicting or uniformly weak. There is no clear edge. These are the setups that most manual traders take anyway -- because they are bored, or because one indicator looks compelling in isolation -- and then regret. The composite scoring system gives you permission to stay flat. Not every minute of the trading day presents a tradeable opportunity, and low scores help you avoid the unprofitable trades that erode your edge over time.
Threshold Discipline: The single most impactful thing you can do with composite scores is set a minimum threshold and stick to it. Traders who only take setups above their threshold consistently outperform those who override the system "just this once." The QubTrading dashboard makes it easy to see scores in real time and enforce your threshold discipline.
Real-World Examples: High vs. Low Scores
To make composite scoring concrete, let us walk through two contrasting scenarios that illustrate the difference between a high-quality setup and a low-quality one.
Example: High Score During US Open
It is 9:35 AM ET. MNQ has just opened and the first 5-minute candle closes with strong bullish momentum. Here is what the 10 factors show:
- Panel Alignment: All timeframe panels agree on bullish direction -- full alignment.
- Momentum: Strong and accelerating, with the initial move confirming pre-market directional bias.
- Trend: Intermediate-term trend is bullish and fresh, having reversed just yesterday.
- Volume: Opening volume is 2.5x the session average -- strong institutional participation.
- VWAP Deviation: Price just crossed above VWAP and is holding -- bullish confirmation.
- Market Structure: Price broke above yesterday's high, establishing a new higher high.
- Session Context: Opening drive is the highest-probability window for trend continuation.
- Volatility Regime: Expanding from overnight compression -- breakout conditions.
- Order Flow: Aggressive buyers dominating with large orders on the bid side.
- Adaptive Performance: Opening-drive long signals have been performing well over the past 5 sessions.
Result: a premium composite score. Nearly every factor is aligned and supportive. This is the kind of setup where traders who trust the scoring system capture the majority of the opening move.
Example: Low Score During Midday Chop
It is 12:15 PM ET. MNQ has been ranging for an hour after the morning move faded. Here is the factor breakdown:
- Panel Alignment: Short-term panels say bullish, intermediate says bearish, long-term is neutral -- no agreement.
- Momentum: Flat, with small oscillations in both directions.
- Trend: No clear trend on any timeframe -- choppy, directionless price action.
- Volume: Volume has dropped to 40% of the morning average -- thin participation.
- VWAP Deviation: Price is oscillating around VWAP with no sustained deviation -- neutral.
- Market Structure: No clear support/resistance levels being tested -- price is mid-range.
- Session Context: Midday window historically produces the lowest win rates.
- Volatility Regime: Low volatility with no compression pattern suggesting an imminent breakout.
- Order Flow: Balanced with no dominant side -- institutional traders are waiting.
- Adaptive Performance: Midday signals have underperformed for the past week.
Result: a low composite score. The system is telling you clearly: there is no edge here. The best trade is no trade. Manual traders who force entries during these conditions are the ones who give back their morning profits.
How to Use Composite Scores in Your Trading
Understanding the scoring system is one thing. Integrating it into your daily trading workflow is another. Here are practical strategies for making composite scores a core part of your decision-making process:
Set Your Personal Threshold
Start by establishing a minimum composite score threshold below which you will not trade. This is your first line of defense against overtrading and low-probability setups. More conservative traders set higher thresholds (fewer trades, higher win rate), while more aggressive traders set lower thresholds (more trades, lower win rate but potentially more total profit). Review your risk management parameters to determine which approach fits your trading plan.
Use Scores for Position Sizing
Composite scores are not just entry filters -- they are also position-sizing guides. A premium score might warrant your full standard position size, while a medium score might call for a half-size entry. This approach lets you participate in more setups while concentrating your capital on the highest-conviction signals. The math is straightforward: larger positions on your best signals and smaller positions on moderate ones produces better risk-adjusted returns than uniform sizing.
Track Score-to-Outcome Correlation
One of the most valuable exercises you can do is track the relationship between composite scores and trade outcomes over time. The QubTrading dashboard provides this data automatically, showing you win rates, average profits, and average losses broken down by score range. This data helps you fine-tune your threshold and build genuine confidence in the system -- not blind faith, but evidence-based trust.
Combine with Your Market Read
The composite score is a powerful tool, but it is most effective as part of the hybrid approach we described in our AI vs. manual trading comparison. Use the score as your quantitative foundation, then apply your own contextual knowledge: upcoming economic events, unusual market conditions, or sector-specific news that the scoring system may not fully capture. The score tells you "how strong is this setup technically?" -- you add the judgment of "does the broader context support it?"
Pro Tip: Keep a simple trading journal that logs the composite score for every trade you take. After 50+ trades, you will have enough data to identify your personal sweet spot -- the score range where your execution is most profitable. Most QubTrading community members find that their best results come from being highly selective and only trading the top-tier scores.
Getting Started with Composite Scoring
If you have been trading with individual indicators and are ready to upgrade to a systematic, multi-factor approach, here is the path forward:
- Explore the dashboard demo. The interactive QubTrading demo shows you exactly how composite scores appear in real-time, how they change as market conditions evolve, and how the factor breakdown gives you visibility into what is driving each score.
- Start with observation. Before trading live with composite scores, spend a few sessions simply watching how the scores correlate with price action. Note the moments when high scores fire and what happens next. Note the low-score periods and how much money you would have saved by sitting out.
- Set conservative thresholds. When you begin using scores for live trading, start with a conservative (high) threshold. It is better to miss a few good trades than to take too many mediocre ones while you are still learning the system.
- Review and adjust. After 2-4 weeks of live use, review your results. The dashboard's performance tracking will show you exactly how different score ranges performed. Use this data to calibrate your threshold for your specific trading style and risk tolerance.
- Join the community. The QubTrading Discord community is full of traders sharing their composite scoring strategies, threshold settings, and real-time analysis. Learning from other traders' experience accelerates your own learning curve significantly.
Conclusion
Composite scoring represents a fundamental shift in how traders evaluate opportunities. Instead of staring at a wall of conflicting indicators and making gut-feel decisions, you have a single, AI-optimized number that synthesizes 10 independent factors into one clear assessment of setup quality.
The traders who thrive with composite scoring share one trait: discipline. They trust the score, respect their thresholds, and resist the urge to override the system when boredom or FOMO strikes. The data consistently shows that higher composite scores correlate with better outcomes -- and that the most profitable traders are the most selective ones.
Ready to see composite scoring in action? Choose your QubTrading plan and start trading with a systematic, AI-powered edge that processes 10 factors so you do not have to. Visit our features page for a full breakdown of everything included in the platform.